聽說在Ubuntu上做大概2小時內就可以搞定這次作業
我在FreeBSD上搞了快3天啊…被Nan搞到崩潰
如果想偷懶的人可以右轉ubuntu版
NA HW5 – Network Management
Part 1 – SNMP (30%)
- net-snmp
- community Access Control. (10%)
> On bsd1-6.
> narouser can read the SNMP info while public can’t. - IP address Access Control. (10%)
> Use narouser community.
> On bsd1-6 can read .1.3.6.1.2.1.25.3.2.1.3 while linux1-6 can’t.
> HOST-RESOURCES-MIB::hrDeviceDescr - Write Access Control (10%)
> On bsd1-6.
> Set 1.3.6.1.2.1.1.4.0 to the value given at demo.
> SNMPv2-MIB::sysContact.0
> narwuser can set the value, while narouser can’t.
Part 2 – RRD (20%)
- rrdtool
> Draw your file system usage graph.
> Use df command to get your file system usage.
> Monitor one of the file system. Update it every minute.
> Draw the graph in the past 1 hour.
> Output file should be in PNG format. - Example: http://i.imgur.com/bMd3NU4.png
Part 3 – cacti (50%)
- cacti
> Show localhost CPU loading info graph. (15%)
> Show localhost network traffic graph. (15%)
> Show the other computer’s network traffic graph. (20%)
Bonus – Make your own graph
- Make your own data template, graph template, and draw your own graph.
- What graphs you can make:
> Calculate the memory used instead of memory free.
> Calculate the times of login failed.
前置作業
首先先裝好FAMP
/usr/ports/www/apache24
/usr/ports/lang/php5
/usr/ports/www/mod_php5
/usr/ports/databases/mysql56-server/
再裝這次作業需求的port
/usr/ports/net-mgnt/net-snmp
/usr/ports/net-mgnt/cacti
/usr/ports/databases/rrdtool
最好都用port裝,pkg爛掉的機率太大了
rc.conf
apache24_enable="YES"
mysql_enable="YES"
snmpd_enable="YES"
snmpd_flags="-a"
snmptrapd_enable="YES"
snmptrapd_flags="-a -p /var/run/snmptrapd.pid"
Part 1 – SNMP (30%)
rocommunity public (for SNMPv1/2c)
rwcommunity private
rouser user1 (for SNMPv3)
rwuser user2
ro 就是 read only
rw 就是 read&write
本次作業使用SNMPv1 v2為主並採用linux6(140.113.235.156 )和bsd6(140.113.235.136)作為demo機器
設定snmpd.conf
$ sudo vim /usr/local/share/snmp/snmpd.conf
# 打開對外的udp port
# agentAddress upd:127.0.0.1:161
agentAddress upd:161,udp6:[::1]:161

rocommunity public  localhost

#開read權限給另外一台snmp機器,讓他可以收到這台機器的snmp資訊
rocommunity another  128.199.167.53

#新增有read,write權限的narwuser,並限制IP和可存取的OBJ
rwcommunity narwuser 140.113.235.136 .1.3.6.1.2.1.1.4.0

#       sec.name    source          community
com2sec bsd6        140.113.235.136 narouser
com2sec linux6      140.113.235.156 narouser

#                      sec.model sec.name
group bsd_group        v1        bsd6
group bsd_group        v2c       bsd6
group linux_group      v1        linux6
group linux_group      v2c       linux6

#                    incl/excl subtree                  mask
view bsd_view        included  .1
view linux_view      excluded  .1.3.6.1.2.1.25.3.2.1.3

#                       context sec.model sec.level match  read           write  notif
access bsd_group        ""      any       noauth    exact  bsd_view        none none
access linux_group      ""      any       noauth    exact  linux_view      none none

#主機所在位置、管理員聯絡資料
# sysLocation    Sitting on the Dock of the Bay
# sysContact     me@example.org
強烈建議一定要讀過View Access Control
詳細的解釋了com2sec,group,view,access的設定方式
一般其實用ro/rwcommunity就可以搞定簡單的權限存取了
只不過作業要求的Spec比較複雜,必須用此方式實作
為什麼要註解掉Location跟Contact呢?
因為作業有個Spec要修改 SNMPv2-MIB::sysContact.0 的值
如果snmpd.conf內有設定此參數,該參數會變成read-only
snmpset會噴noSuchName(v1) 和 notWritable(v2c)
實際測試
bsd6 > snmpwalk -c narouser -v1 .1.3.6.1.2.1.25.3.2.1.3
HOST-RESOURCES-MIB::hrDeviceDescr.196608 = STRING: Intel(R) Xeon(R) CPU E5-2630L v2 @ 2.40GHz
HOST-RESOURCES-MIB::hrDeviceDescr.262145 = STRING: network interface vtnet0
HOST-RESOURCES-MIB::hrDeviceDescr.262146 = STRING: network interface vtnet1
HOST-RESOURCES-MIB::hrDeviceDescr.262147 = STRING: network interface lo0
HOST-RESOURCES-MIB::hrDeviceDescr.786432 = STRING: Guessing that there's a floating point co-processor
linux6 > snmpwalk -c narouser -v1 .1.3.6.1.2.1.25.3.2.1.3
End of MIB
bsd6 > snmpset -c narwuser -v1 sysContact.0 s “admin@nctu.edu.tw"
bsd6 > snmpget -c narwuser -v1 sysContact.0
SNMPv2-MIB::sysContact.0 = STRING: admin@nctu.edu.tw
Part 2 – RRD (20%)
中文教學
名詞介紹
這個部份我的完成度比較低,貼上學長的SCRIPT供大家參考
timestep=60                       //每60秒更新一次
duration=3600                     //紀錄一小時(3600秒)
let numofdot=$duration/$timestep  //有60個點
starttime=$(date +%s)
rrdtool create disk.rrd --step "$timestep" --start "$starttime" DS:disk:GAUGE:"$timestep":0:U RRA:AVERAGE:0.5:2:"$numofdot"

for i in `seq 0 1 $numofdot`
do
  usage=$(df -m / | awk 'NR > 1 {print $3}')      //使用df得到使用量
  nowtime=$(date +%s)                             //現在時間
        rrdtool update disk.rrd "$nowtime":"$usage"
        sleep $timestep
done

rrdtool dump disk.rrd
rrdtool graph disk.png --title "Disk Usage" -v "Disk Usage (MByte)" -X 9 --start "$starttime" DEF:t1=disk.rrd:disk:AVERAGE LINE1:t1#ff0000:"/dev/sda6"
要展示給助教看的話,把圖片放到網頁上即可
$sudo vim /usr/local/www/apache24/data/index.html
加入此行 (記得把你的disk.png跟index.html放到同目錄底下)
我是把這個script放到crontab
用root定期去撈資料
<img src="./disk.png"></img>
Part 3 – cacti (50%)
這篇文章有非常詳細的解釋,看他就夠了
Create the MySQL database, a cacti user, and initialize:
mysql_secure_installation
mysql -u root -p
CREATE DATABASE cacti;
CREATE USER ‘cacti’@’localhost’ IDENTIFIED BY ‘password’;
FLUSH PRIVILEGES;
GRANT ALL ON cacti.* TO ‘cacti’@’localhost’;
FLUSH PRIVILEGES;
Import the default cacti database:
mysql –database=cacti -ucacti -p > /usr/local/share/cacti/cacti.sql
定期讓poller去撈資料
crontab -u cacti -e
*/5 * * * * /usr/local/bin/php /usr/local/share/cacti/poller.php > /dev/null 2>&1
時區要設定好,不然cacti會噴給你看
cp /usr/local/etc/php.ini-production /usr/local/etc/php.ini
date.timezone =Asia/Taipei
vim /usr/local/etc/apache24/httpd.conf
LoadModule php5_module libexec/apache22/libphp5.so

AddType application/x-httpd-php .php .php5 .phtml
AddType application/x-httpd-php-source .phps

DirectoryIndex index.php index.html

Alias /cacti "/usr/local/share/cacti/"
Alias /Cacti "/usr/local/share/cacti/"
<Directory "/usr/local/share/cacti">;
Require all granted
AllowOverride None
Device皆使用Generic SNMP-enable HOST,SNMP Version選v2
該如何獲得Traffic?
Associated Data Queries內必需要有SNMP – Interface Statistics這個來源
且Status內的Items和Rows要有資料,如果都為0就表示SNMP有問題,資料沒抓好
該如何獲得Load Average 和 CPU Usage?
在Associated Graph Templates內選擇
ucd/net – CPU Usage
Unix – Load Average
看起來應該會長這樣
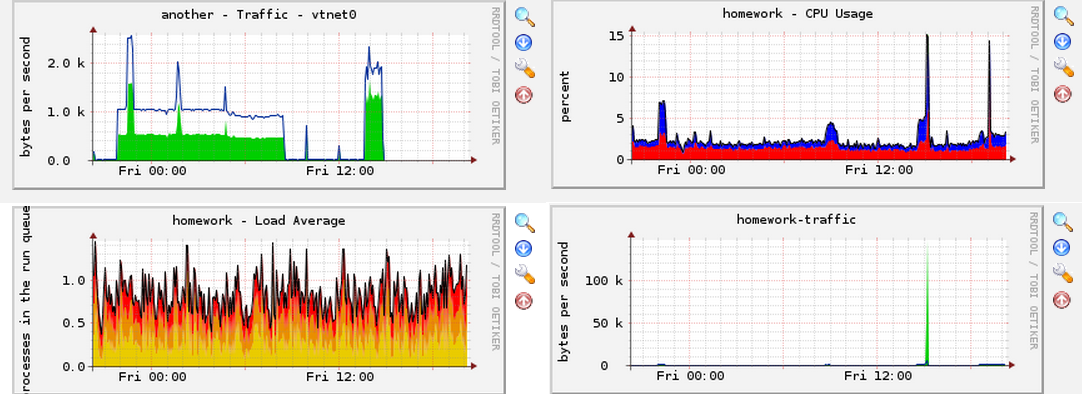
another是我監控別台機器的Traffic
homework上顯示了CPU usage,Load Average和Traffic
完工!!
疑難雜症區
cacti圖表都是nan
- 直接清cacti的cache
system utilities –> Rebuild poller cache
如果上面方法無法解決,那就要進行細部檢查 - 看看cacti server能不能抓到被監控主機(假設IP是192.168.1.1)的snmp資料
snmpwalk -v 2c -c public 192.168.1.1
如果正常,你會看到一連串的資訊,不然你就要檢查雙方主機的snmp或者之間的連線 - 檢查cacti/rra/有沒有文件,正常會有很多rrd的檔案,隨便找一個web1192_168_0_50_traffic_in_713.rrd做測試
rrdtool fetch web1192_168_0_50_traffic_in_713.rrd AVERAGE
如果是-nan -nan -nan就是不正常,因為rrdtool沒正常運作 - 從apache的log中查找是否有相關的資訊,也能提供問題解決的方向
CMDPHP: Poller[0] Host[1] DS[3] WARNING: Result from CMD not valid.
chmod a+x /var/www/html/cacti/cmd.php
cacti log內發現的
error on subcontainer ‘swrun container’ insert (-1)
https://forums.freebsd.org/threads/snmpd-spams-log-with-error-on-subcontainer-swrun-container-insert-1.51799/
snmp log內發現的

請問一下,你用ports 安裝net-snmp 沒有遇到錯誤嗎?
我在 10.1 底下去net-snmp 目錄作 make install
會發生一堆找不到檔案的錯誤,不知道怎麼解…
我有用portmaster來裝 有沒有詳細的error log呢?
像是討厭的error code 1 ….